Market Volatility Infographic ~ Election Edition
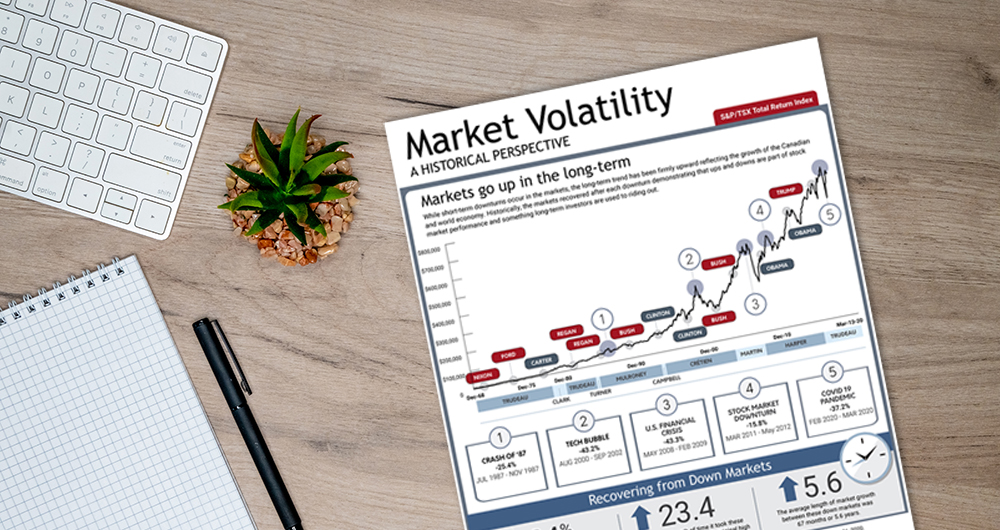
2020 has been a tough year on our emotions and the upcoming U.S. election is only adding to it. Your clients may be wondering about market volatility around election time so we’ve updated the FreshPlan Market Volatility infographic labelling administration changes in the U.S. and Canada since 1968.
Politics can bring out strong emotions and biases, but investors would be wise to not let this drive their investment decisions. While past results don’t guarantee future performance, history shows that election results have very little impact on long-term returns.
“We can always expect volatility, but we shouldn’t fear it. As is often the case with investing, staying focused on a long-term investment strategy is more prudent rather than trying to time markets around elections or other events.”
Clients may be nervous about market volatility surround the U.S. election. This FreshPlan infographic offers a historical perspective taking into consideration the changes in administration since 1968.
Infographic Features
- Communicate complex concepts with vibrant, sharable, easy-to-understand infographics
- Personalized for individual Advisors
- Current and timely for client communications
- One of many infographics included in FreshPlan software
Calculate. Educate. Plan.
Communicate complex concepts from all areas of financial planning with current, visual infographics.
FreshPlan combines 75 calculators with powerful infographics and planners to provide advisors with a visual, easy-to-use, time saving planning and education tool and can be accessed anywhere, anytime using any device – phone, tablet, iPad, laptop or desktop.